
Overview
Teaching: 0 min
Exercises: 20 minQuestionsObjectives
- What does a simple notebook with some analysis look like?
- How can keyboard shortcuts speed up my work?
- Get started with notebooks for analysis.
- Practice common keyboard shortcuts.
- Get a feeling for the importance of execution order.
Creating a computational narrative
Let’s create our first real computational narrative in a Jupyter notebook (adapted from Python and R data analysis course at Aalto Science IT).
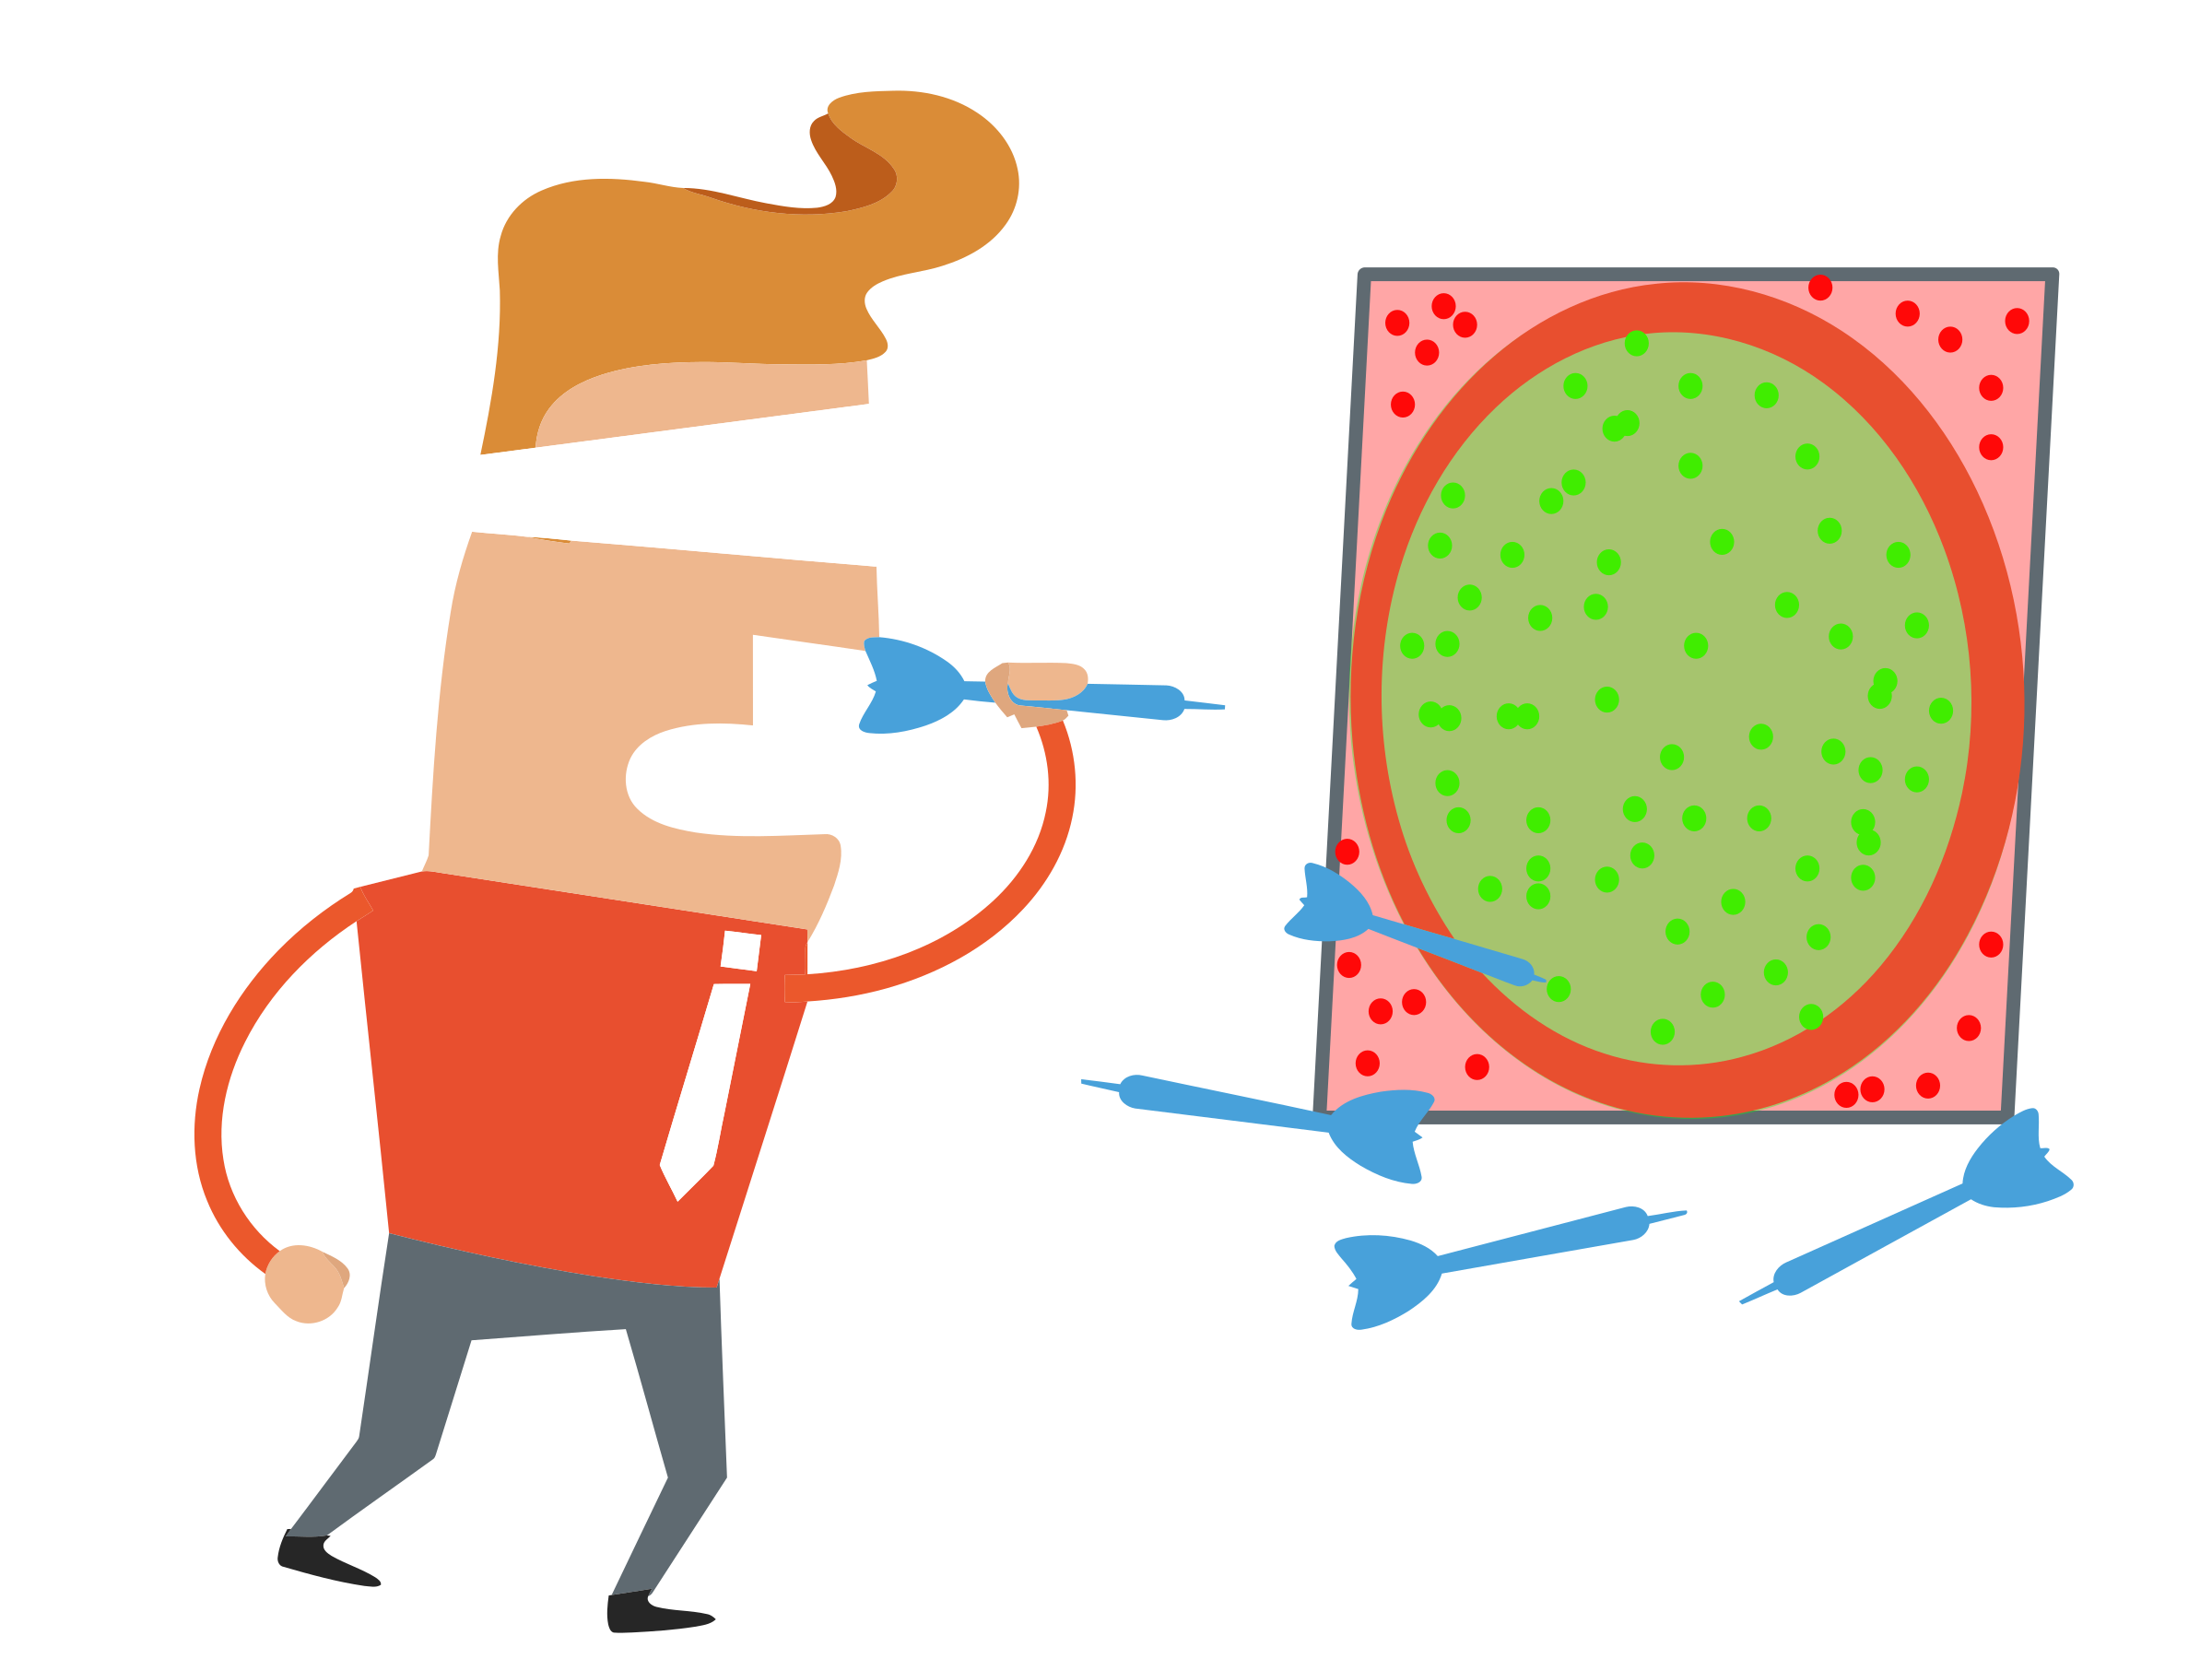
Imagine you are on a desert island and wish to compute pi. You have a computer with you with Python installed but no math libraries and no Wikipedia.
Here is one way of doing it - “throwing darts” by generating random points within a square area and checking whether the points fall within the unit circle.
Opening a webpage inside JupyterLab
If you would like to copy-paste content from this webpage into your Jupyter notebook, a cool way of doing it is to open this page inside an IFrame:
from IPython.display import IFrame
IFrame(src="https://coderefinery.github.io/jupyter/", width='100%', height='500px')
Exercise/demonstration: Calculating pi using Monte Carlo methods
This can be either done as a 20 minute exercise or as a type-along demo.
- Create a new notebook, name it, and add a heading.
- Document the relevant formulas in a new cell:
- square area: $s = (2 r)^2$ - circle area: $c = \pi r^2$ - $c/s = (\pi r^2) / (4 r^2) = \pi / 4$ - $\pi = 4 * c/s$- Add an image to explain the concept:
- Import two modules that we will need:
import random import matplotlib.pyplot as plt- Initialize the number of points:
num_points = 1000- “Throw darts”:
points = [] hits = 0 for _ in range(num_points): x, y = random.random(), random.random() if x*x + y*y < 1.0: hits += 1 points.append((x, y, "red")) else: points.append((x, y, "blue"))- Plot results:
%matplotlib inline x, y, colors = zip(*points) fig, ax = plt.subplots() fig.set_size_inches(6.0, 6.0) ax.scatter(x, y, c=colors)- Compute final estimate of pi:
fraction = hits / num_points
4 * fraction
Here is the notebook: https://github.com/coderefinery/jupyter/blob/gh-pages/example/darts.ipynb (static version, later we will learn how to share notebooks which are dynamic and can be modified).
What do we get from this?
- With code separate from everything else, you might just send one number or a plot to your supervisor/collaborator for checking.
- With a notebook as a narratives, you send everything in a consistent story.
- A reader may still just read the introduction and conclusion, but they can easily see more - and try changes themselves - if they want.
Key Points
Notebooks provide an intuitive way to perform interactive computational work.
Allows fast feedback in your test-code-refactor loop.
Cells can be executed in any order, beware of out-of-order execution bugs!
Keyboard shortcuts can save you time and protect your wrists.